Plot Data
Advertisement
Imgki v.1.5.5
Estimate influx constant fast and easy. imgki help you with the estimation of influx constant (Ki) from dynamic PET images in ECAT 6.3 or 7.
Advertisement
DreamCalc v.4. 7. 2002
DreamCalc is the leading Scientific Graphing Calculator for Windows that's so realistic it dispenses with the need for a physical hand-held altogether! - It Feels Real! Get the intuitive feel and productivity of a real calculator.
Opton v.3 3
Opton is a Windows application designed for use with the Stylitis-10 and Stylitis-Power. dataloggers. Opton replaces Set-10, adding new features such as better management of datalogger sites and easy sensor factor calculation.
CHEMIX School v.4.00
CHEMIX School - Software for Chemistry It is equipped with a periodic table, molecular 3-D viewer, curve fit, spectroscopy, conversion table, dictionary and many advanced graphic tools and calculators. Chemistry lessons and problems are included.
Mathcad Prime v.1.0
The Mathcad can calculate, graph, and communicate technical ideas. It lets us work with mathematical expressions using standard math notation - but with the added capability to recalculate, view, present, and publish with ease,
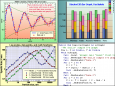
EcGraph for Visual Basic 6 v.3.0.0.0
ecGraph is a powerful graphing ActiveX control that you can drop into your Visual Basic programs to create graphs in a huge range of styles. More Information : http://visualbasic-6.com/ecgraph-for-visual-basic-6.html
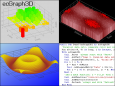
Graph3D for Visual Basic 6 v.3.0.0.0
Create professional quality bar codes with BarCodeWiz ActiveX. More Inofrmation : http://visualbasic-6.com/graph-3d-for-visual-basic-6.html
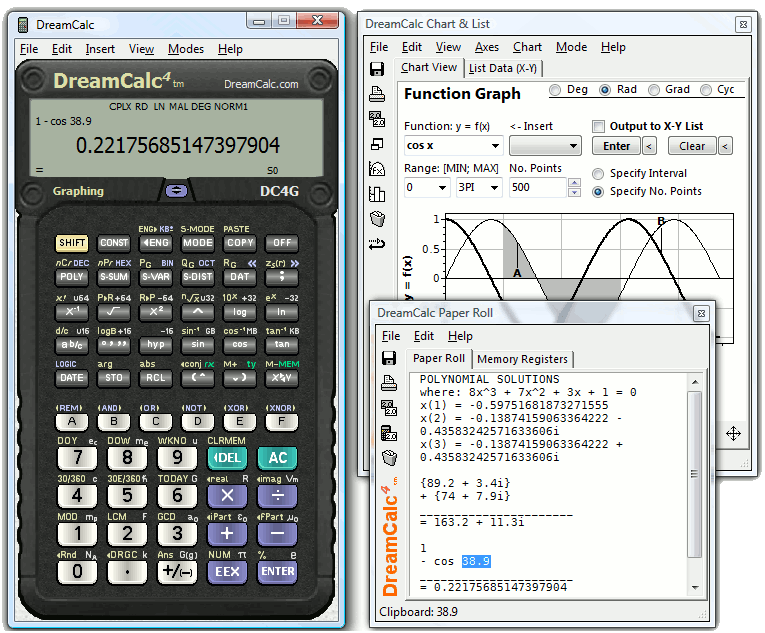
DreamCalc Graphing Edition v.4.8.0
DreamCalc is the leading Graphing Scientific Calculator software that's so realisticOCoit dispenses with the need for a hand-held calculator altogether.
Express Report v.3.5
About EspressReportA powerful toolkit for generating and publishing sophisticated reports & charts.

Visual Data v.3.6.0
Scientific data visualization software. Creating vertex, grid and surface model, color map, contour plot, vector plot, 4D scatter, 4D slice and 4D vector.
PSI-Plot v.9.01.0009
PSI-Plot brings flexibility to technical plotting and data analysis. It has a powerful scientific spreadsheet for data analysis, and an object-oriented on screen graphics editor that makes it easy to design and modify graphs.